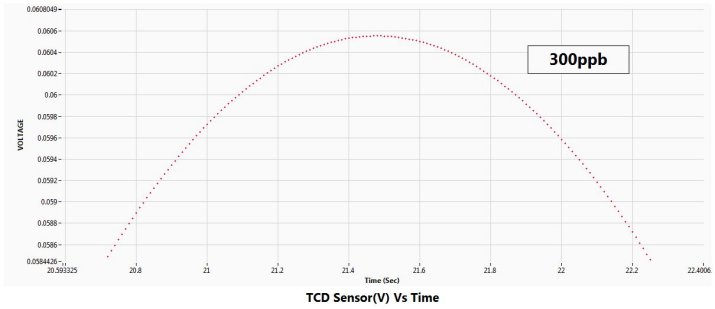
HEMS-M Carbon Monoxide (CO) High Resolution Plot and Data at 300 ppb
[imagemap id=”20007″]
Click on one of the Plot Points in the above graph or one of the links below to view a specific test result chart in the range of 400 ppb to 25 ppb.
CO at 400 ppb CO at 300 ppb CO at 200 ppb
CO at 100 ppb CO at 50 ppb CO at 25 ppb
| [button text=”CO Plots as PDF…” title=”Download Plots” url=”http://www.powerandenergy.com/wp-content/uploads/testresults.pdf” align=”left” target=”_blank” style=”light”] | [button text=”Back to Plot and Data Index” title=”Back to Plot and Data Index” url=”http://www.powerandenergy.com/high-resolution-plots-data/” align=”center” target=”_self” style=”light”] | [button text=”SAE/ISO Spec as PDF…” title=”Download SAE/ISO Spec” url=”http://www.powerandenergy.com/wp-content/uploads/saespec.pdf” align=”right” target=”_blank” style=”light”] |